Edit chart
Loading graph
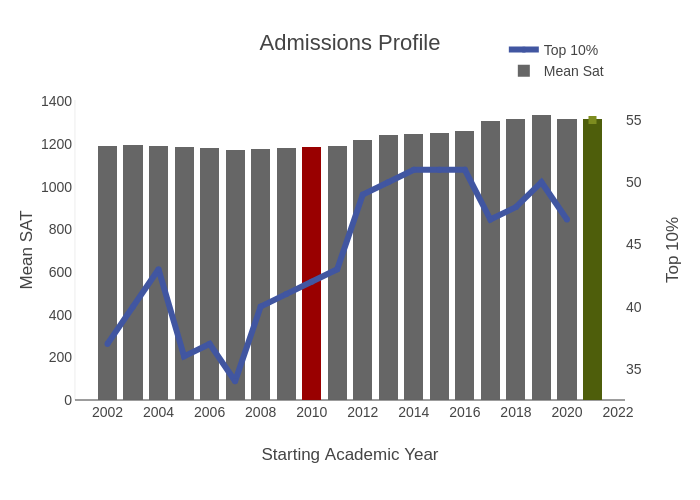
Provostncstate's interactive graph and data of "Admissions Profile" is a stacked bar chart, showing Mean Sat, Top 10%, Mean SAT Baseline, Mean SAT Goal, Top 10% Goal; with Starting Academic Year in the x-axis and Mean SAT in the y-axis.. The x-axis shows values from 2000.8083666365862 to 2022.1916333634138. The y-axis shows values from 0 to 1407.3684210526317. This visualization has the following annotation: New SAT implemented March 2016 and reported in Fall 2017